NVT Signal, a new trading indicator to pick tops and bottoms
NVT Ratio is a new valuation indicator that I introduced last year based on network fundamentals, namely value flowing through the blockchain.
I was delighted to find Dmitry Kalichki created a much more responsive variation which I've been calling NVT Signal.
What is NVT Signal?
Standard NVT Ratio is simply the Network Valuation divided by the Transaction Value flowing through the blockchain and then smoothed using a moving average. What Dimitry did was to apply the moving average just to the volatile Transactions component only without smoothing the already stable Network Valuation component.
This produces a much more responsive chart. Responsive enough to use as a trading indicator.
This is probably the first trading indicator to use blockchain data instead of the basic price and volume data coming in from exchanges.
Using NVT Signal
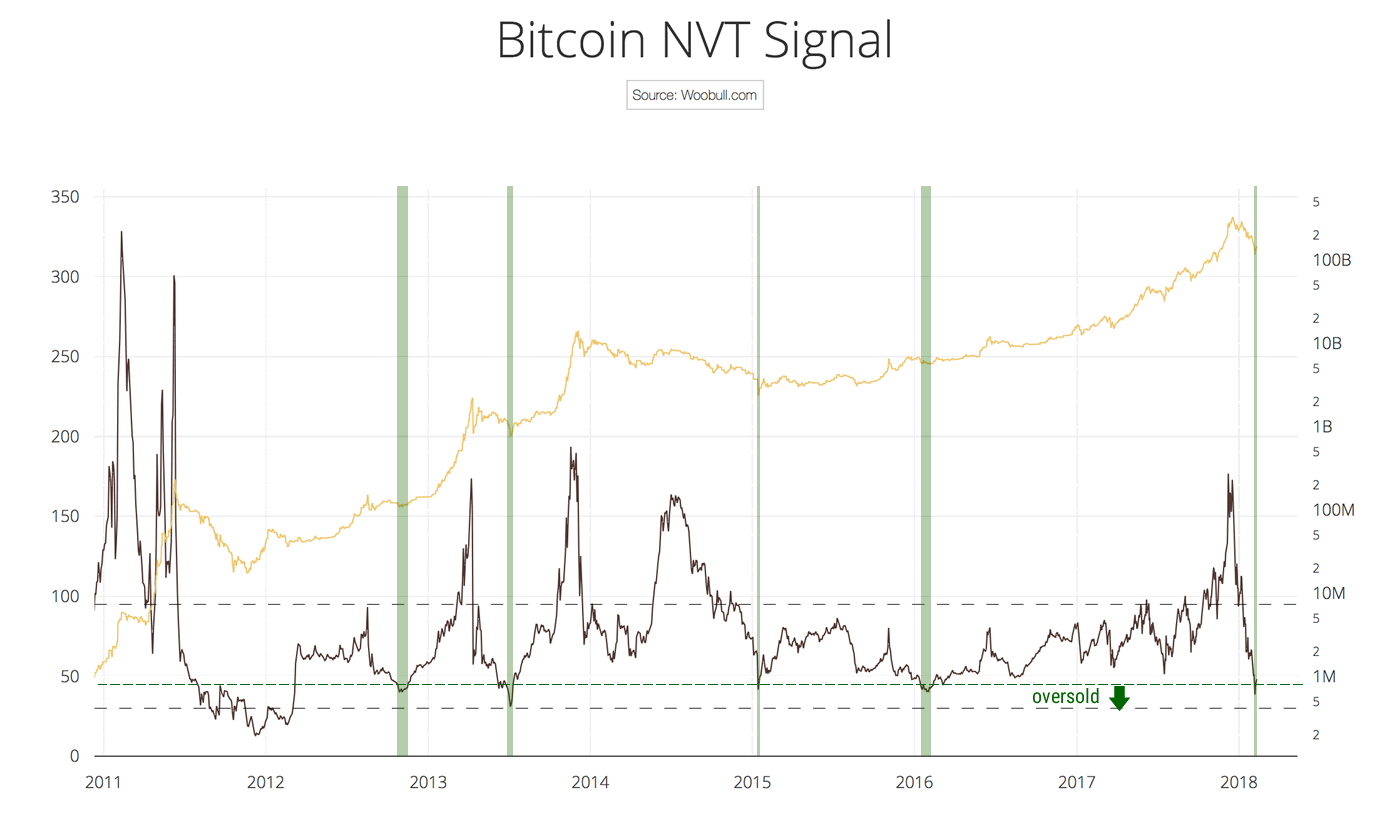
For BTC, any level above 150 is in the overbought zone, indicative of a market top...

...and levels below 45 tends to be oversold...
Calling market tops accurately
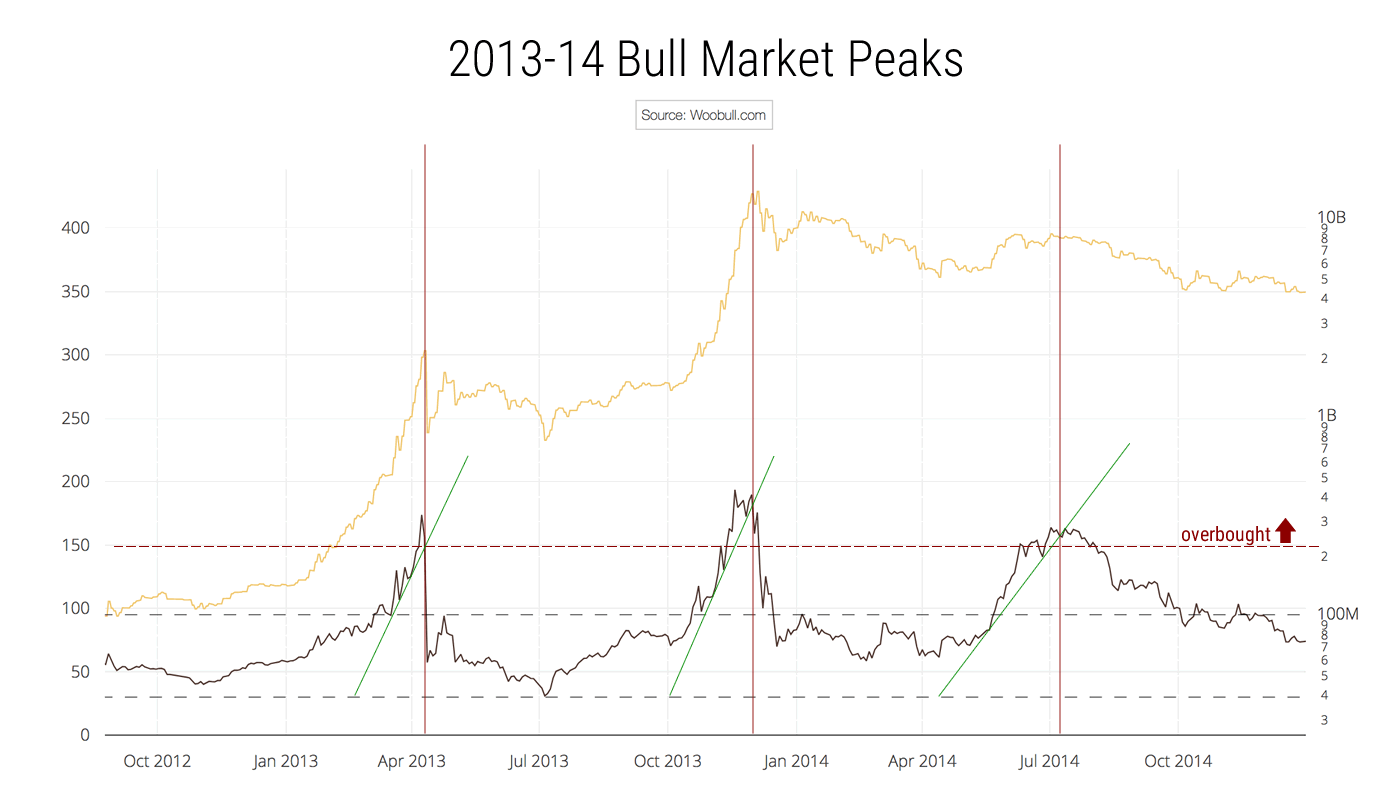
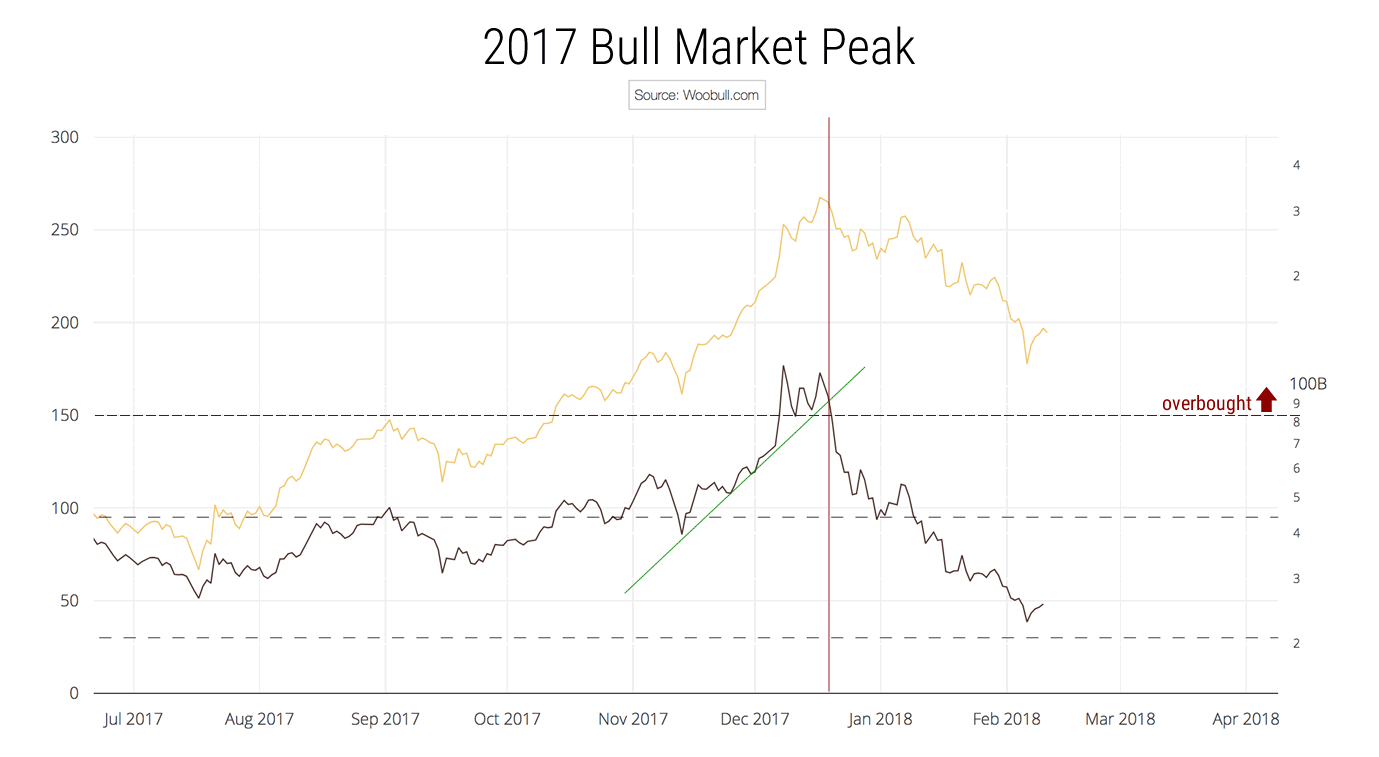
Being in the overbought zone doesn't tell us exactly when the market is about to pop. However by adding support trendlines on the signal, we can call the tops quite accurately.
Here's the tops to the last three BTC bubbles accurately foretold by NVT Signal + trendline technical analysis...
We should be aware that calling market tops has been one of the most elusive things for a trader.
Note I'm drawing these trendlines above in zones when the levels are above 150 (long range overbought). We can also do trendlines below the 150 levels to pick local maximums.
Calling market bottoms accurately
Similarly we can use trendlines to pick bottoms accurately...
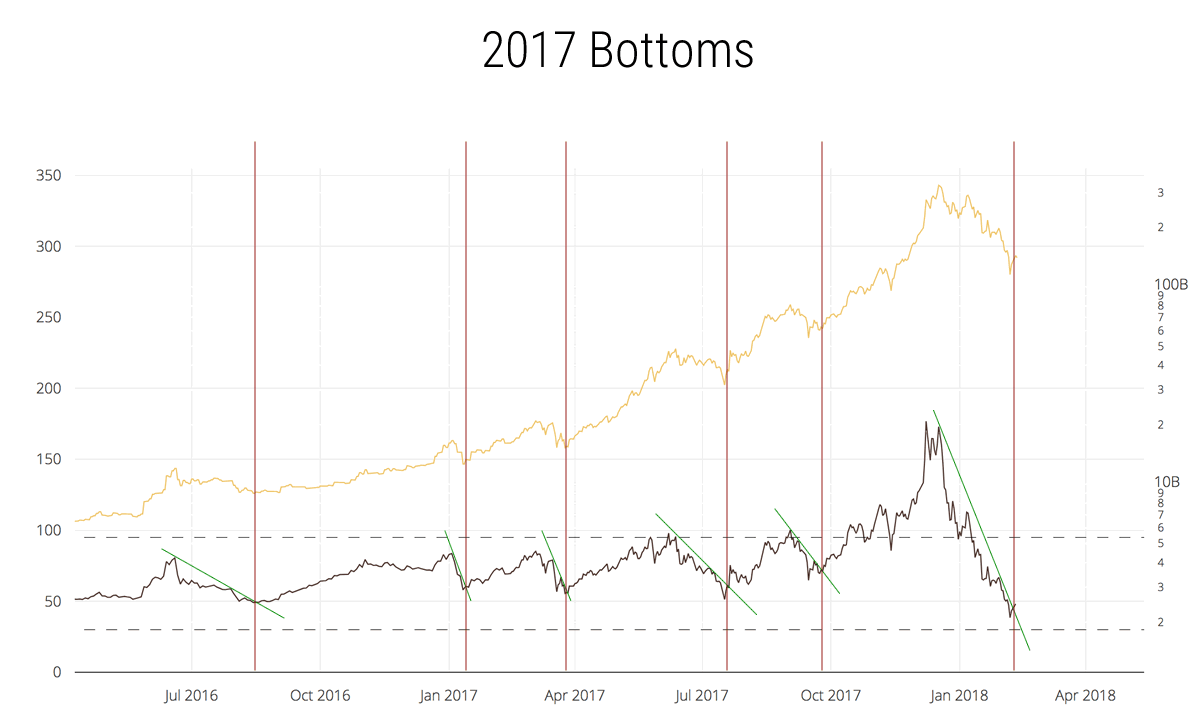
I left you with this chart as this is where BTC is today. The NVT Signal is picking we've bottomed.
Where can I get this chart?
For the time being, I've put a live chart of NVT Signal in Woobull Charts.
For the future, I'm working on a new project called Fomonomics which will bring in a whole array of off-exchange data into view for traders and investors. Watch this space.