Introducing the Difficulty Ribbon, signaling the best times to buy Bitcoin
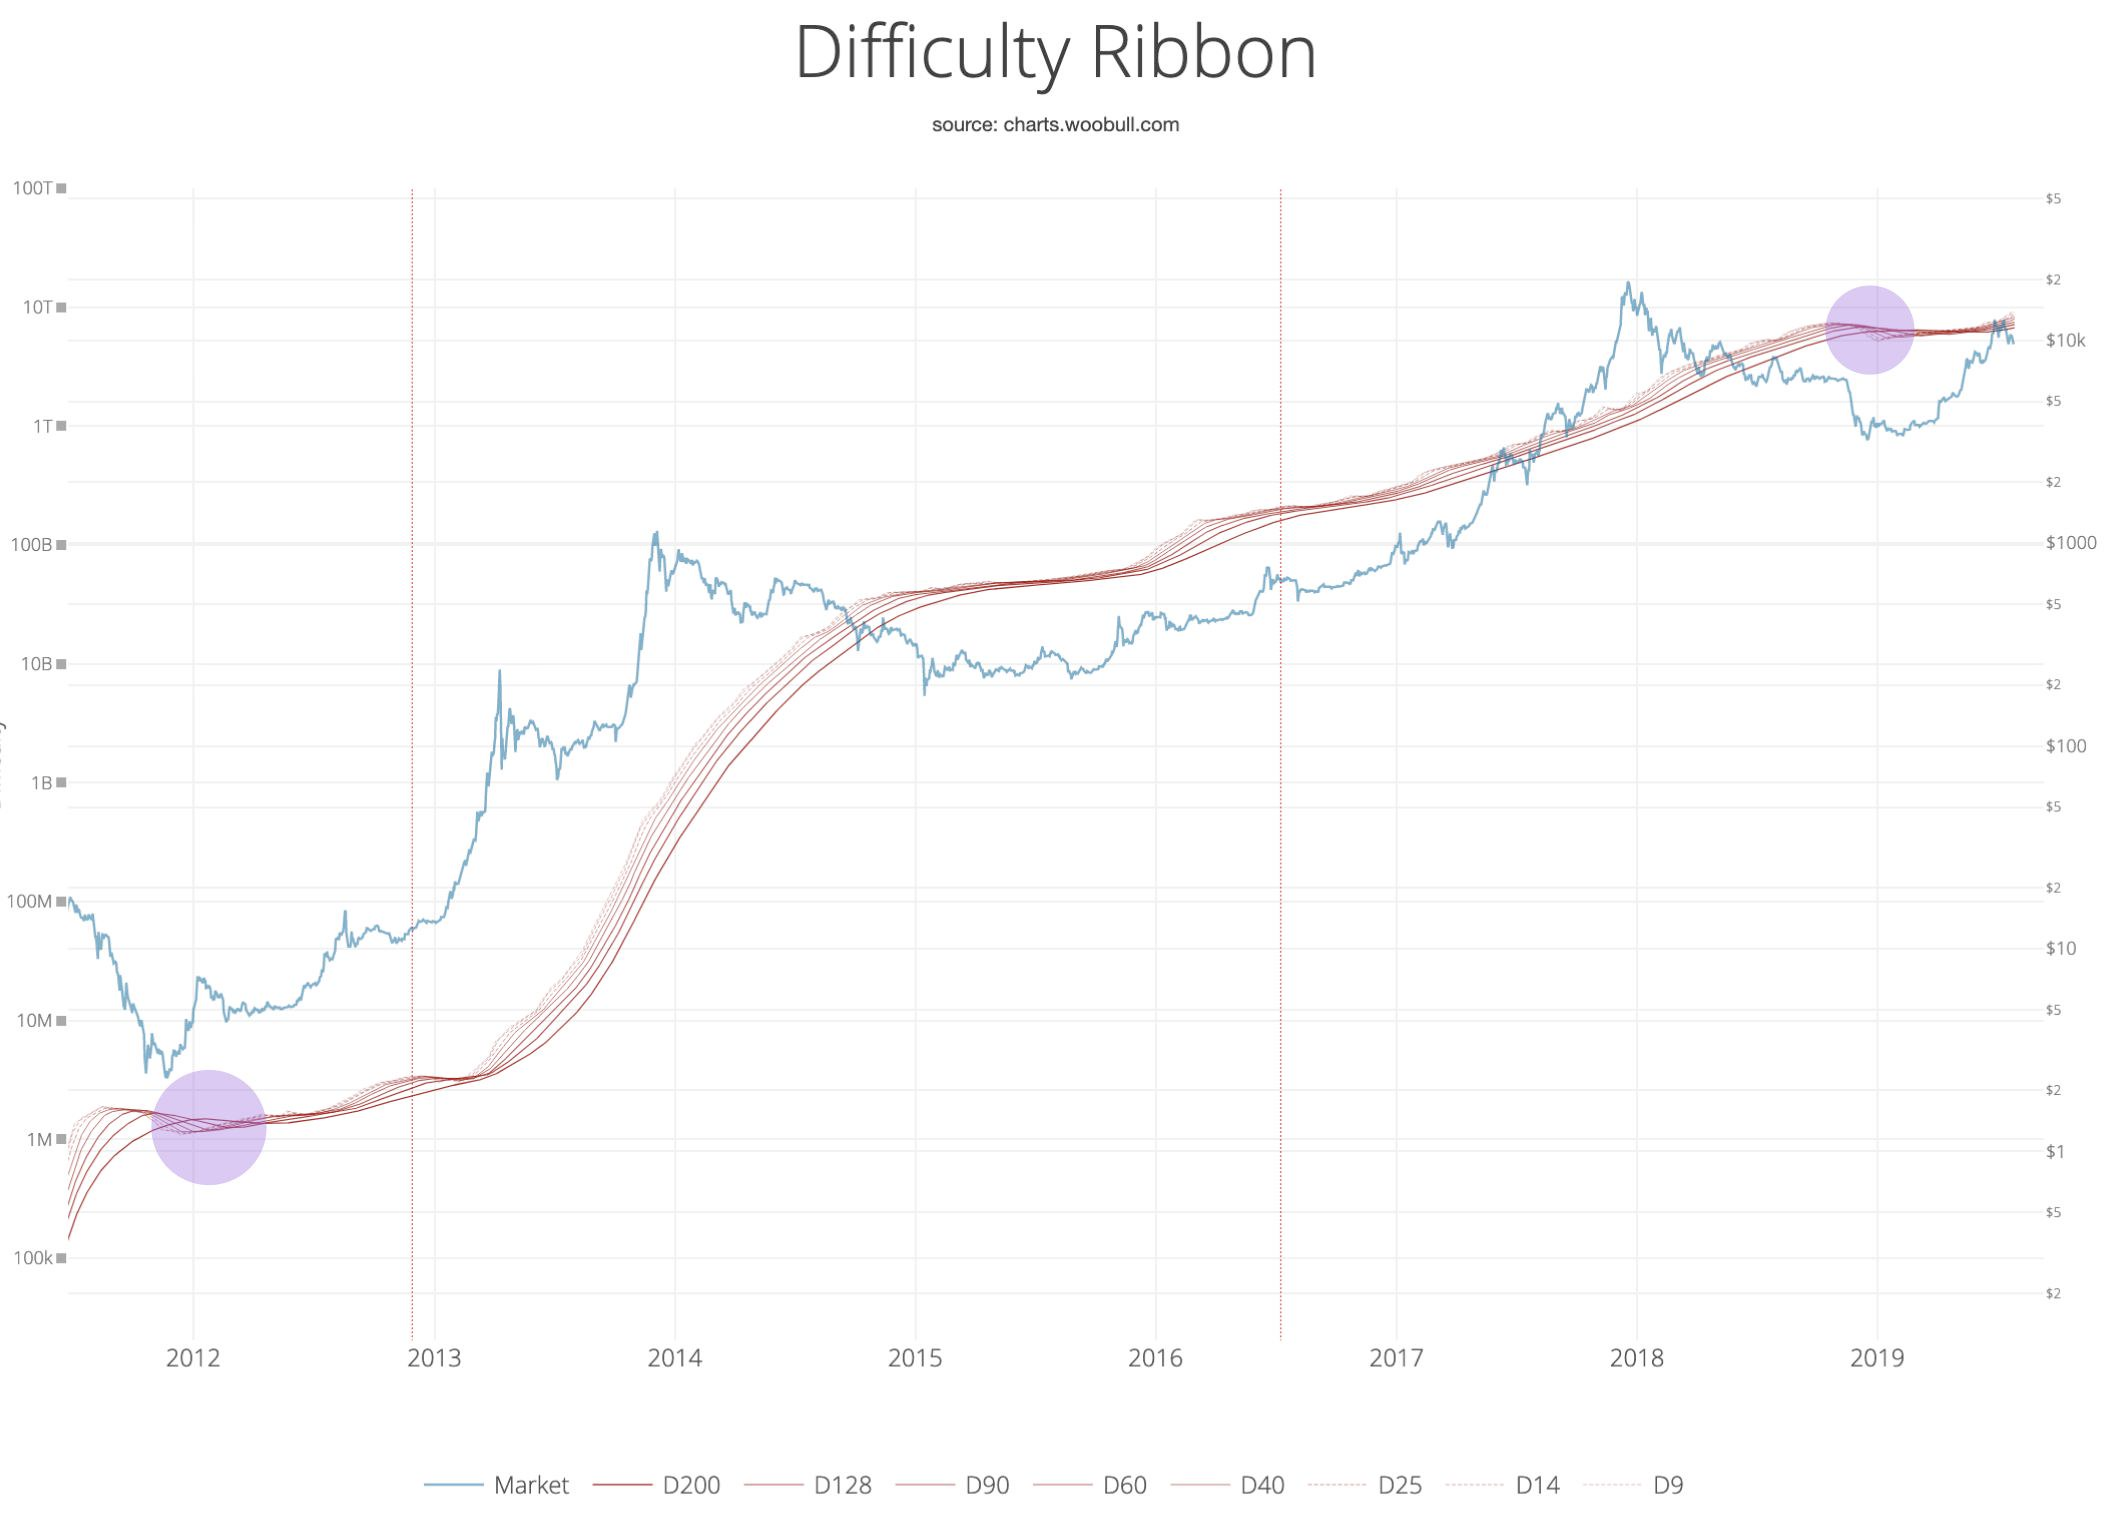
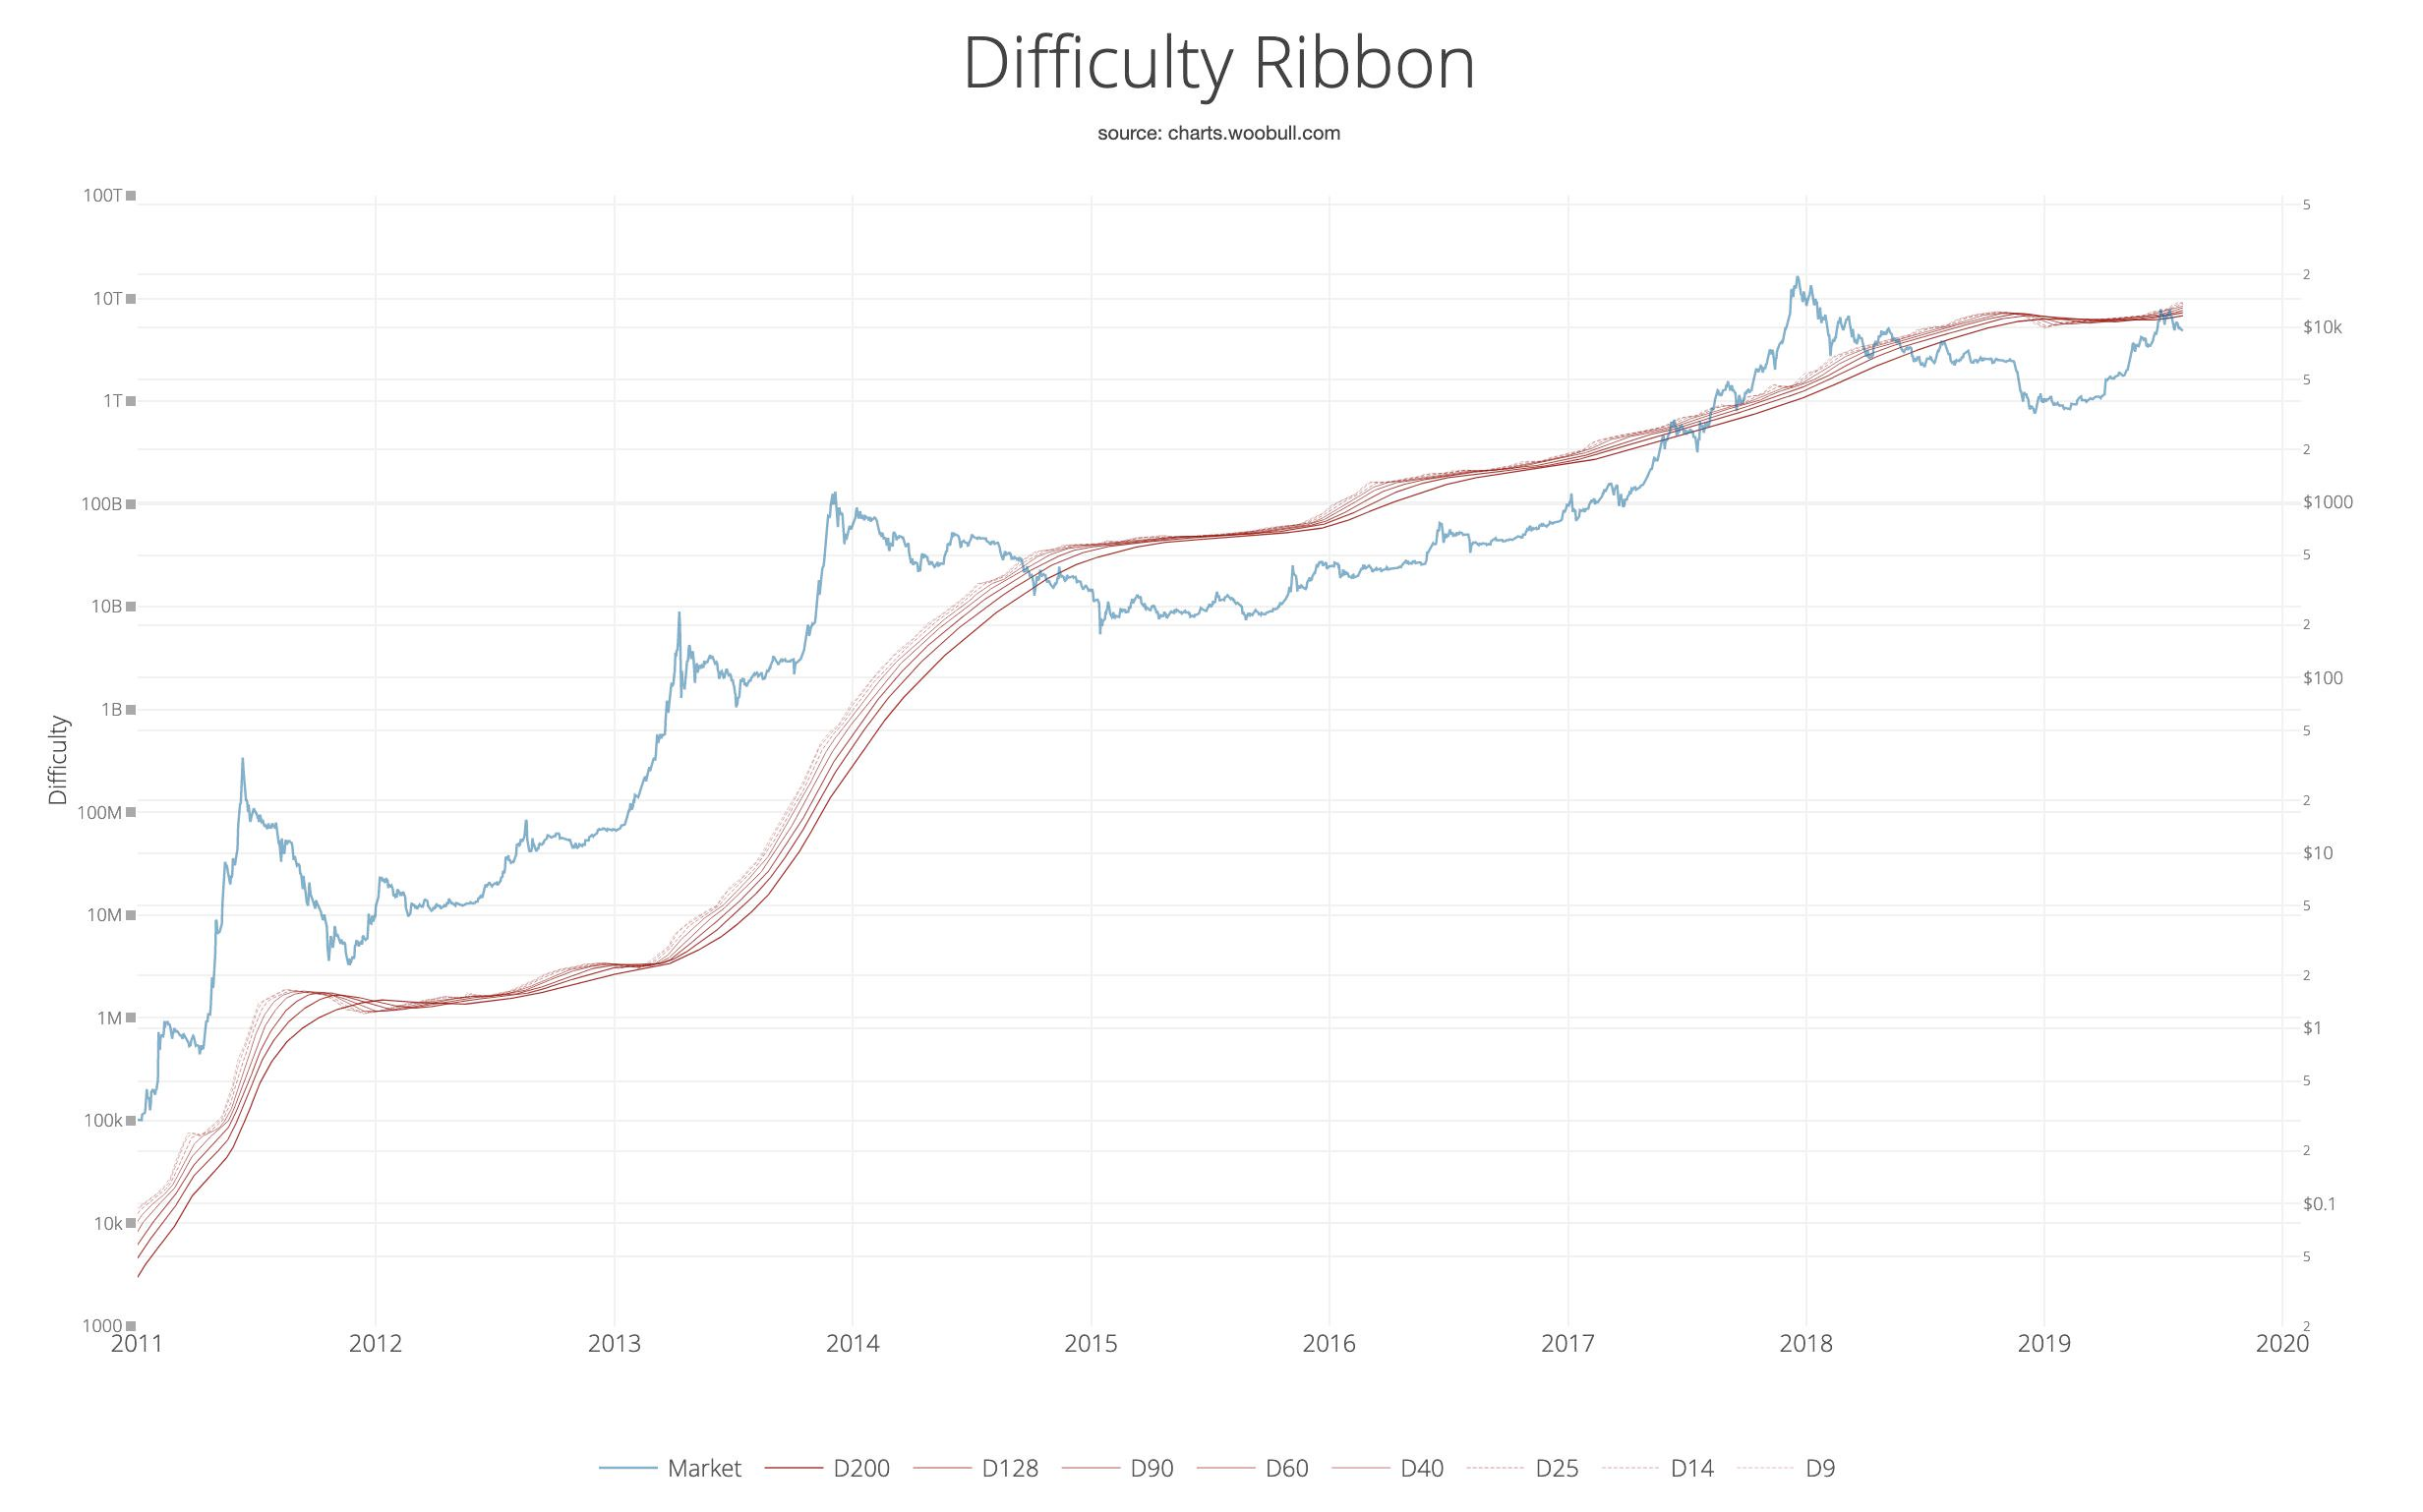
Introducing the Bitcoin Difficulty Ribbon. When the ribbon compresses, or flips negative, these are the best times to buy Bitcoin. The ribbon consists of simple moving averages on mining difficulty so we can easily see the rate of change in difficulty.
How it the Difficulty Ribbon works
This visualisation of network mining difficulty speaks to the impact of mining on Bitcoin's price. As new coins are mined into existence, miners sell some of their mined coins to pay for production costs. This produces bearish price pressure.
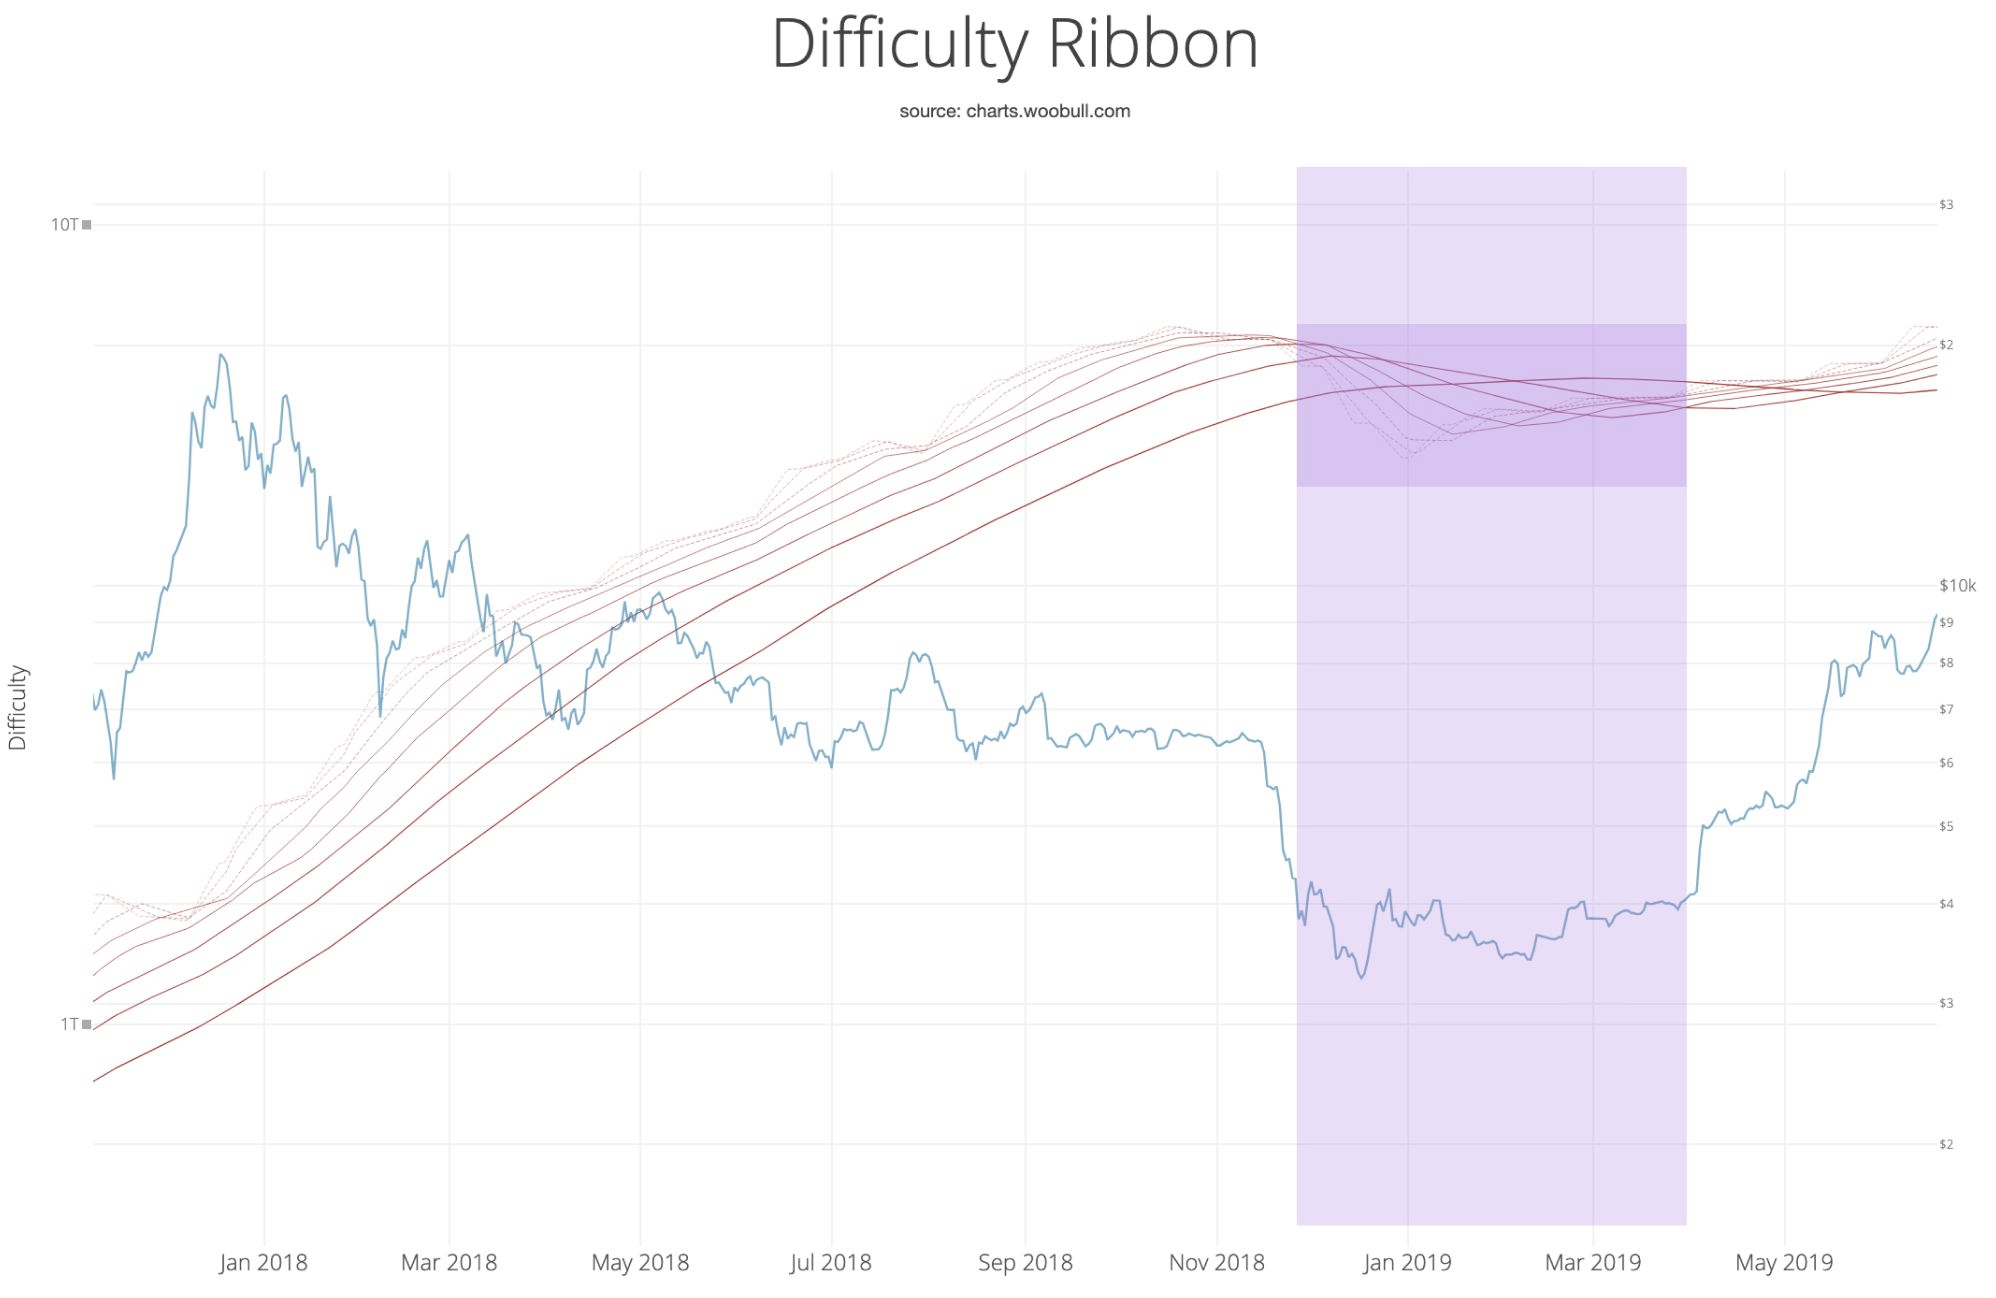
The weakest miners sell more of their coins to remain operational. When it becomes unsustainable, they capitulate, hashing power and network difficulty reduces (ribbon compression), leaving only the strong, who sell less leaving more room for more bullish price action.
Typically we see this at the end of bear cycles, after miners capitulate, the lack of miner selling pressure allows the price to stabilise and then climb; the classic accumulation bottom.
Credit goes to Vinny Lingham who was the first as far as I know to spot this dynamic in his April 2014 article on how Bitcoin finds its price equilibrium. We now have 5 more years of data to back it up.
Miners capitulate in bears, but also during block reward halvening events when suddenly only half the coins are mined for the same costs and the market price has yet to catch up to pay for it. We can easily see the compression after each halvening (marked as vertical lines) as miners die off.
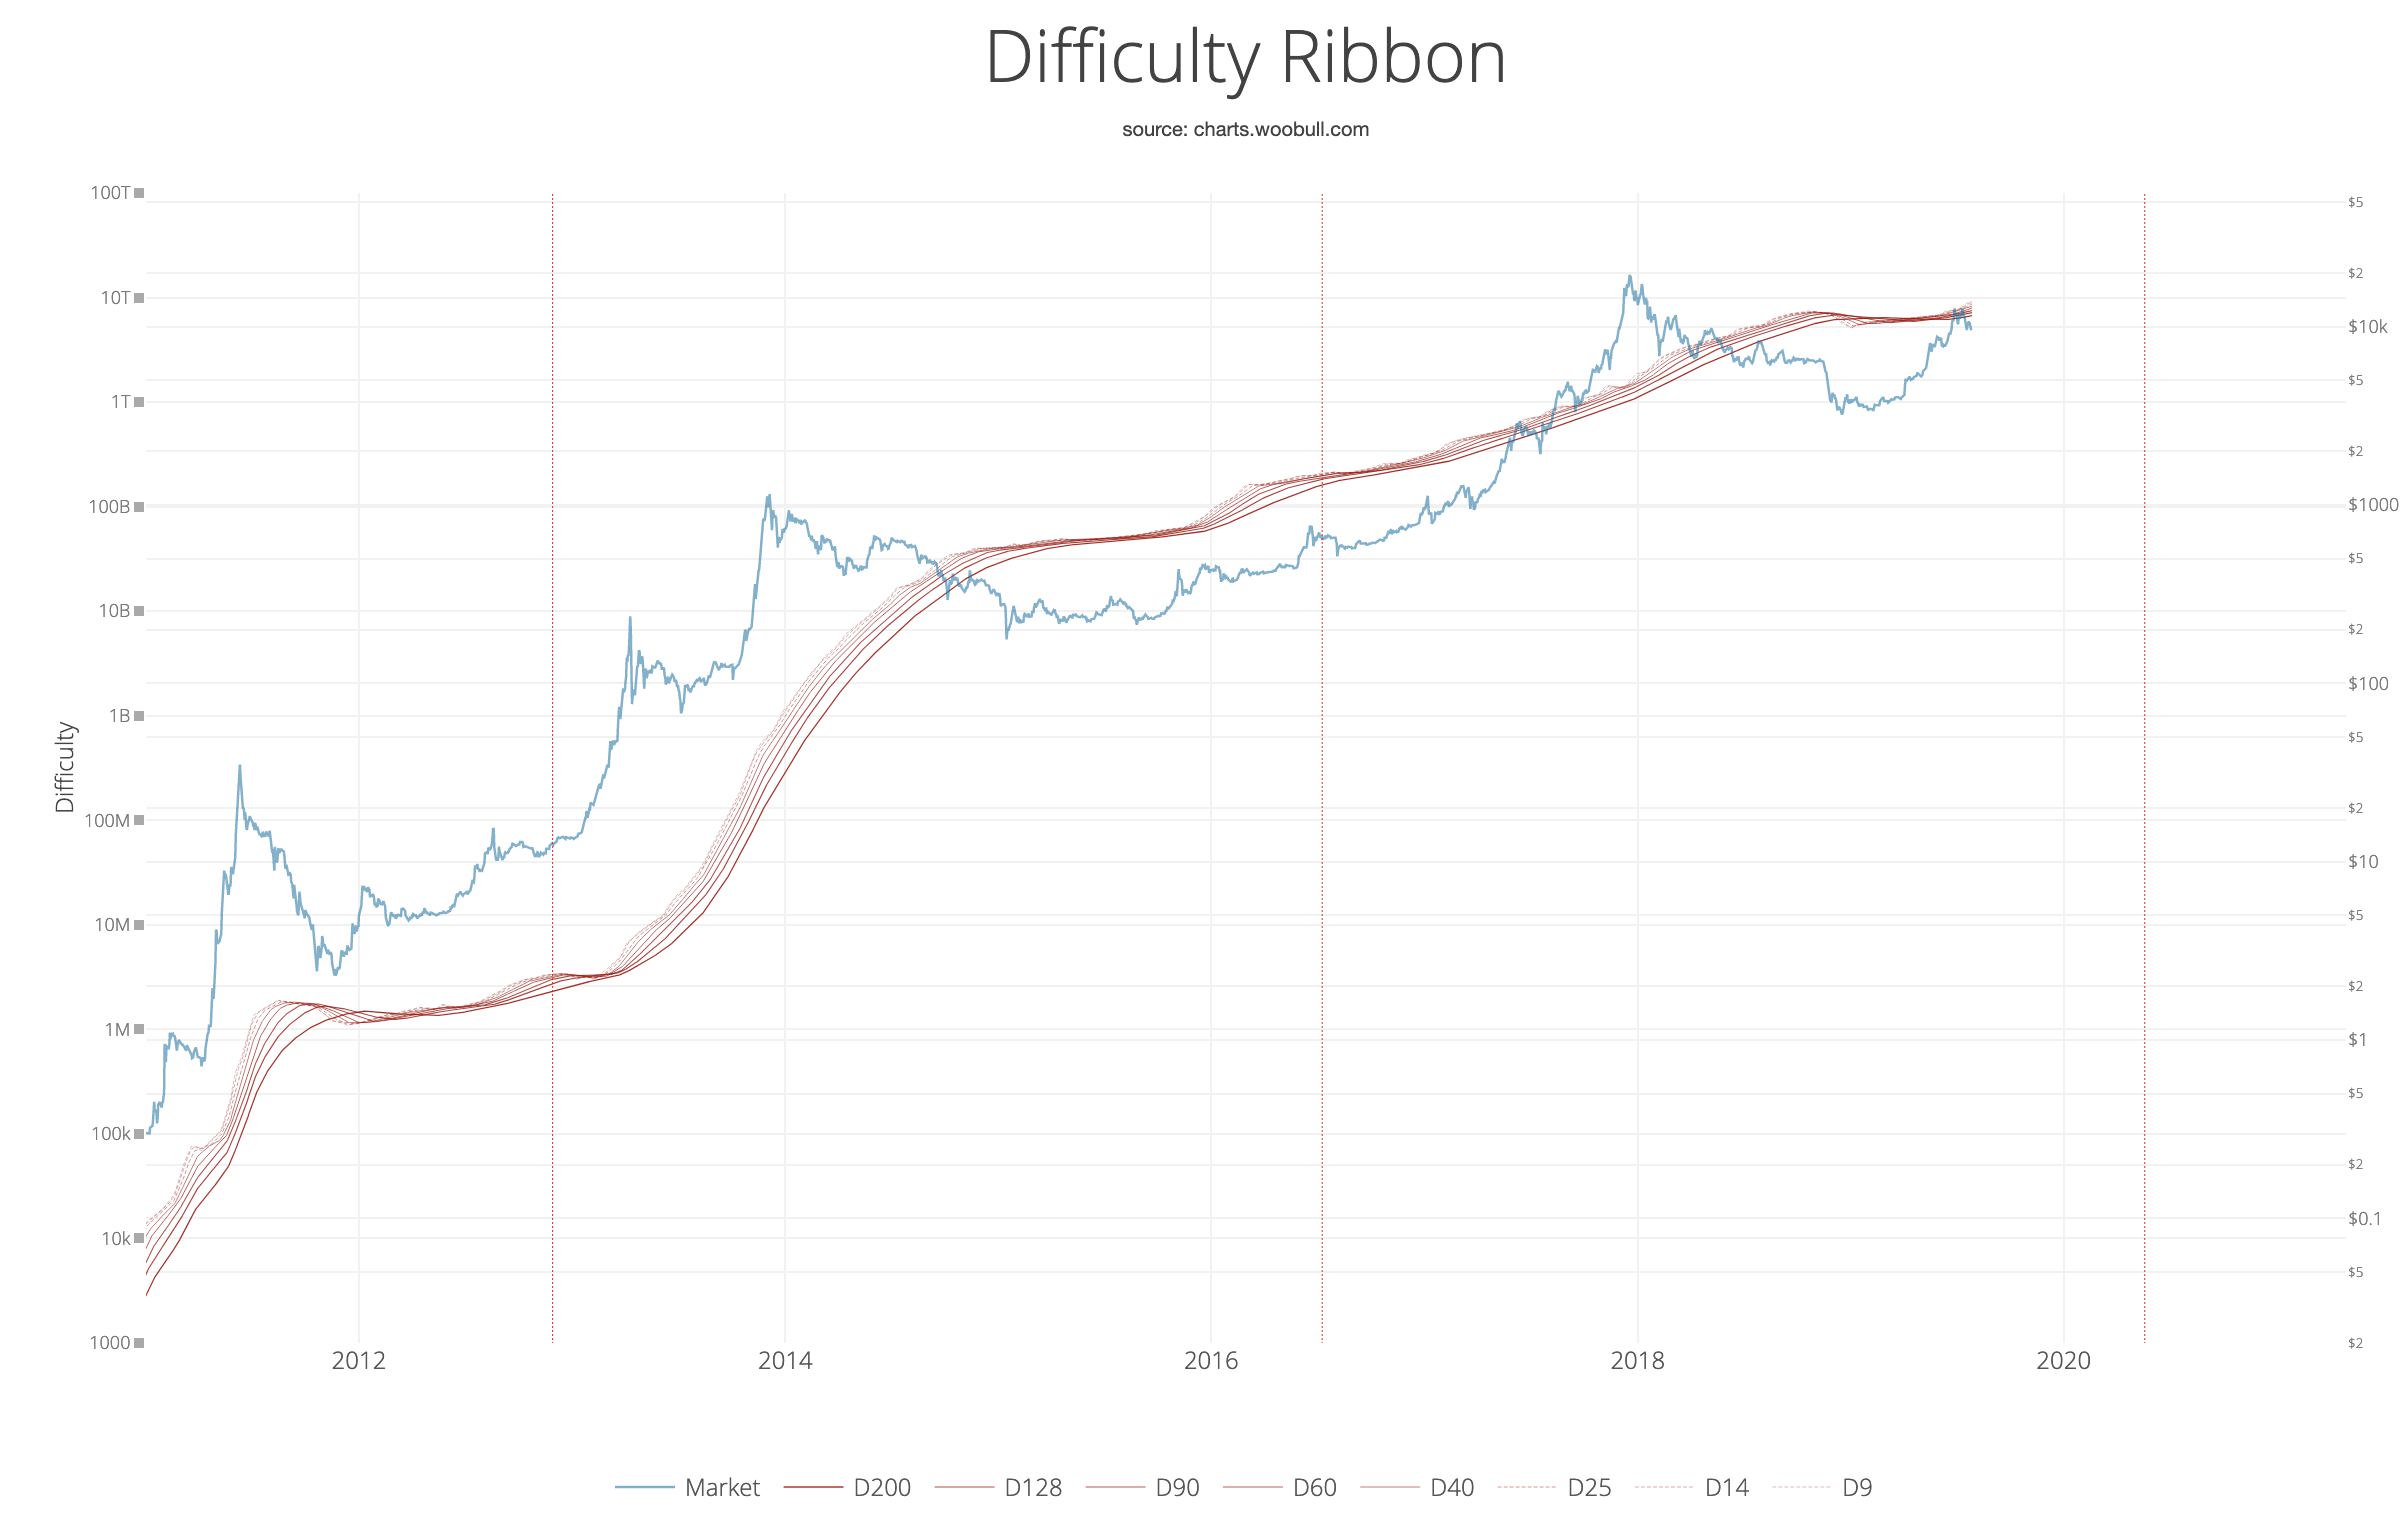
As a final note, notice how the 2019 the 2012 bull market have the same structure, we saw severe mining capitulation (i.e. the ribbon flipped negative), the resulting vacuum in selling pressure lead to a shorter accumulation band before price breakout. Thus this bull market has resembles 2012 more than 2016 structurally.