Estimating the true Bitcoin trading volumes in China, a data-driven approach
Today Chinese exchanges report 98% of global volume. This shows huge dominance by Chinese markets. Unfortunately we know that most of this volume is fake.
Why is it fake?
Unlike the rest of the world, Chinese exchanges are unique in that they do not charge fees on trades. Instead they make their money via withdrawal charges out of the exchange. These fees reduce as your trading volume increase, so this incentivises traders to rack up their trade volume via buying and selling from themselves at zero cost.
There’s a ocean of data coming from the markets, and they hold hidden secrets. In this study, I’ll peer into the data and attempt, as far as I know, the first estimate of true Chinese volumes using data driven methods. I’ll define “true volume” as what the volumes would have been, had their markets actually charged at trading fee.
Prior estimates, really just educated guesses, have put Chinese volumes at 50% of the global market, let’s see how well this compares with the data.
China was not always a zero fees market.
Looking down memory lane, we find that Chinese markets was not always zero fees. BTC China, the first Chinese exchange, started with 0.3% fees on trades. Likewise the second Chinese exchange, OKCoin, initially charged 0.3%.
On the fateful day of 24th September 2013, BTC China instigated what was to be a three month experiment in zero fees. This started an arms race between all the Chinese exchanges, heralding in an era of zero fees, from which China has never returned.
Wanna see what effect zero fees has on trade volumes?
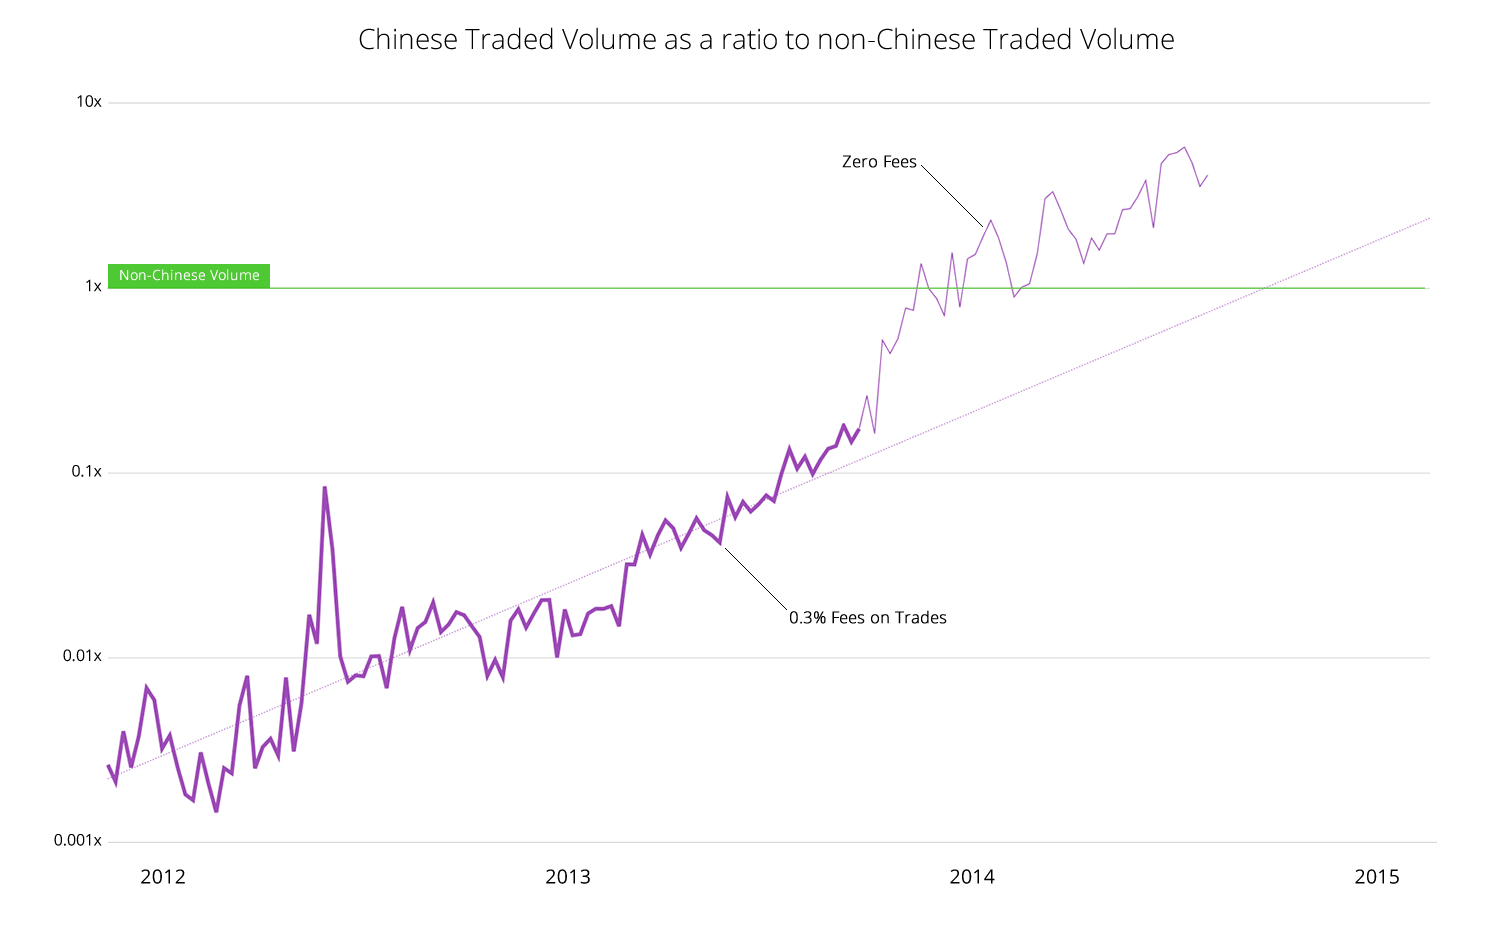
There was an immediate spike in volume. Expressed as a ratio to non-Chinese volume, it went from 17% to well over 100% in barely 6 weeks.
This visualisation is useful in one other aspect, we can see Chinese growth was steadily increase at a predictable rate (of 4% week on week) before the introduction of zero fees. This becomes our first tool to estimate true volume, we can use this steady growth to extrapolate what volumes for some amount of time into the future.
A Chinese Exchange with legit volumes
Now there is one market in China where the volumes have never been faked. Let me introduce you to LocalBitcoins, a decentralised marketplace where buyers and sellers connect and trade.
Here’s what the volumes look like:
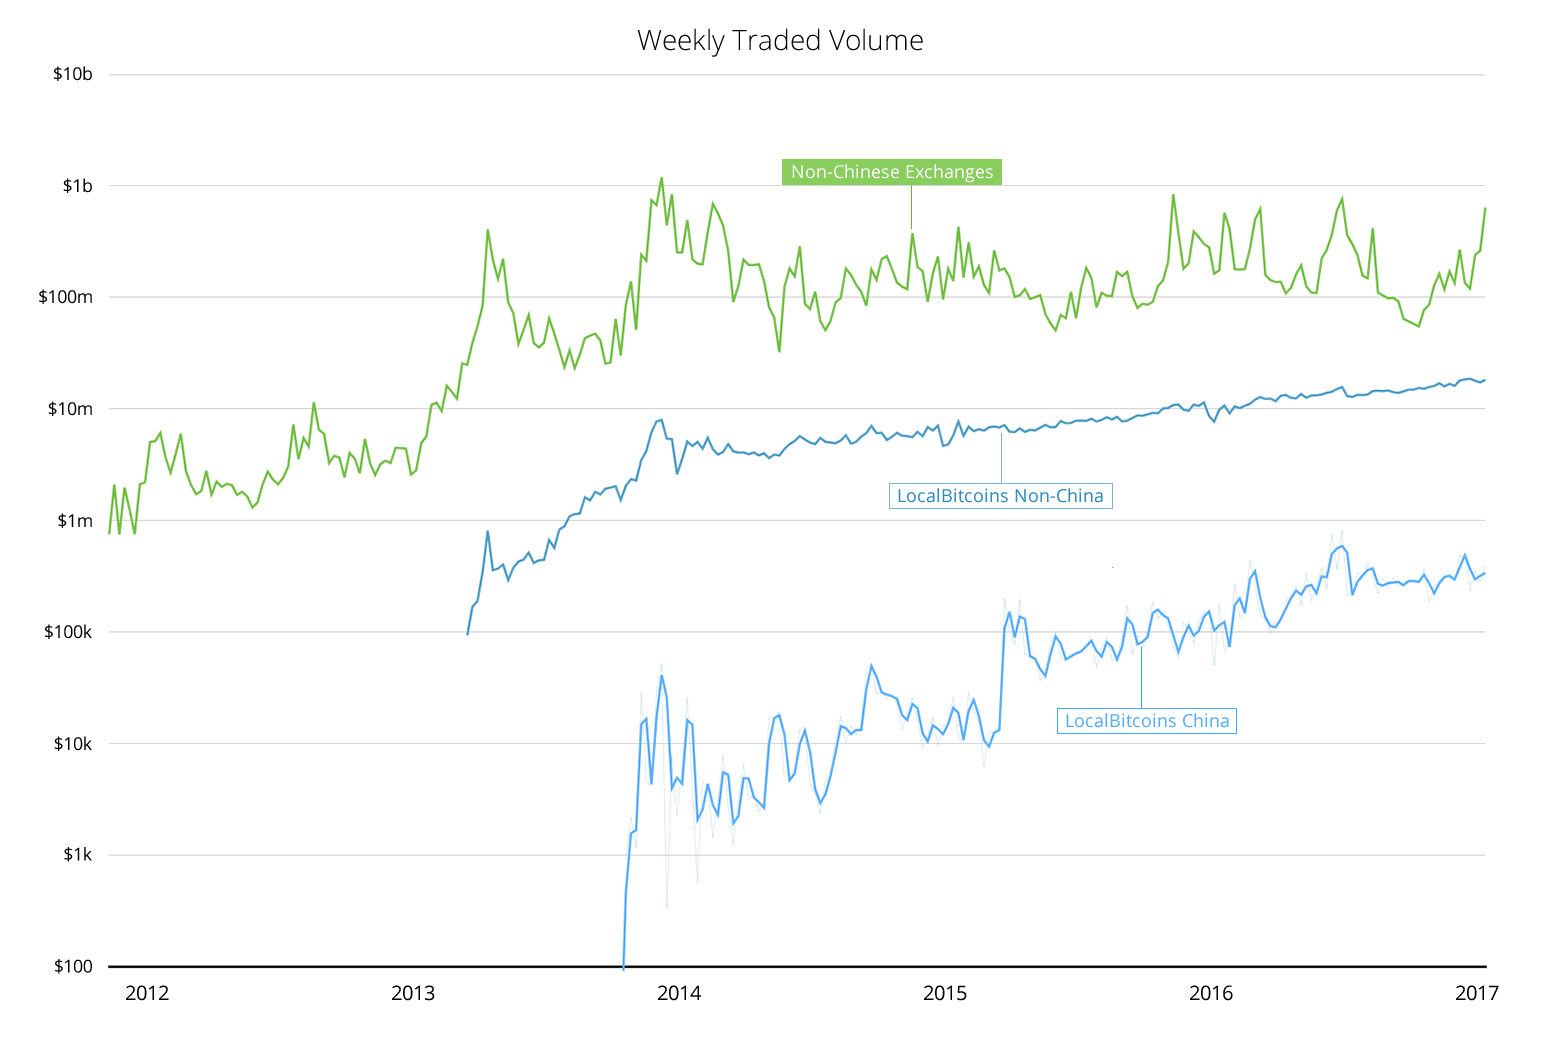
LocalBitcoins was founded in Jun 2012, and you can see it gained traction rapidly, and by Q4 2013 we can see it began tracking global on-exchange volumes quite well.
Now each country has a ratio between “on the streets” LocalBitcoins volume and what volume their local exchange is doing. This ratio differs depending on local conditions, but the two will track each over over time.
This will be our second tool in our estimation strategy. We’ll can use LocalBitcoin volume to show local market demand, and scale it up to estimate exchange volumes. We can do this for China.
Putting it together
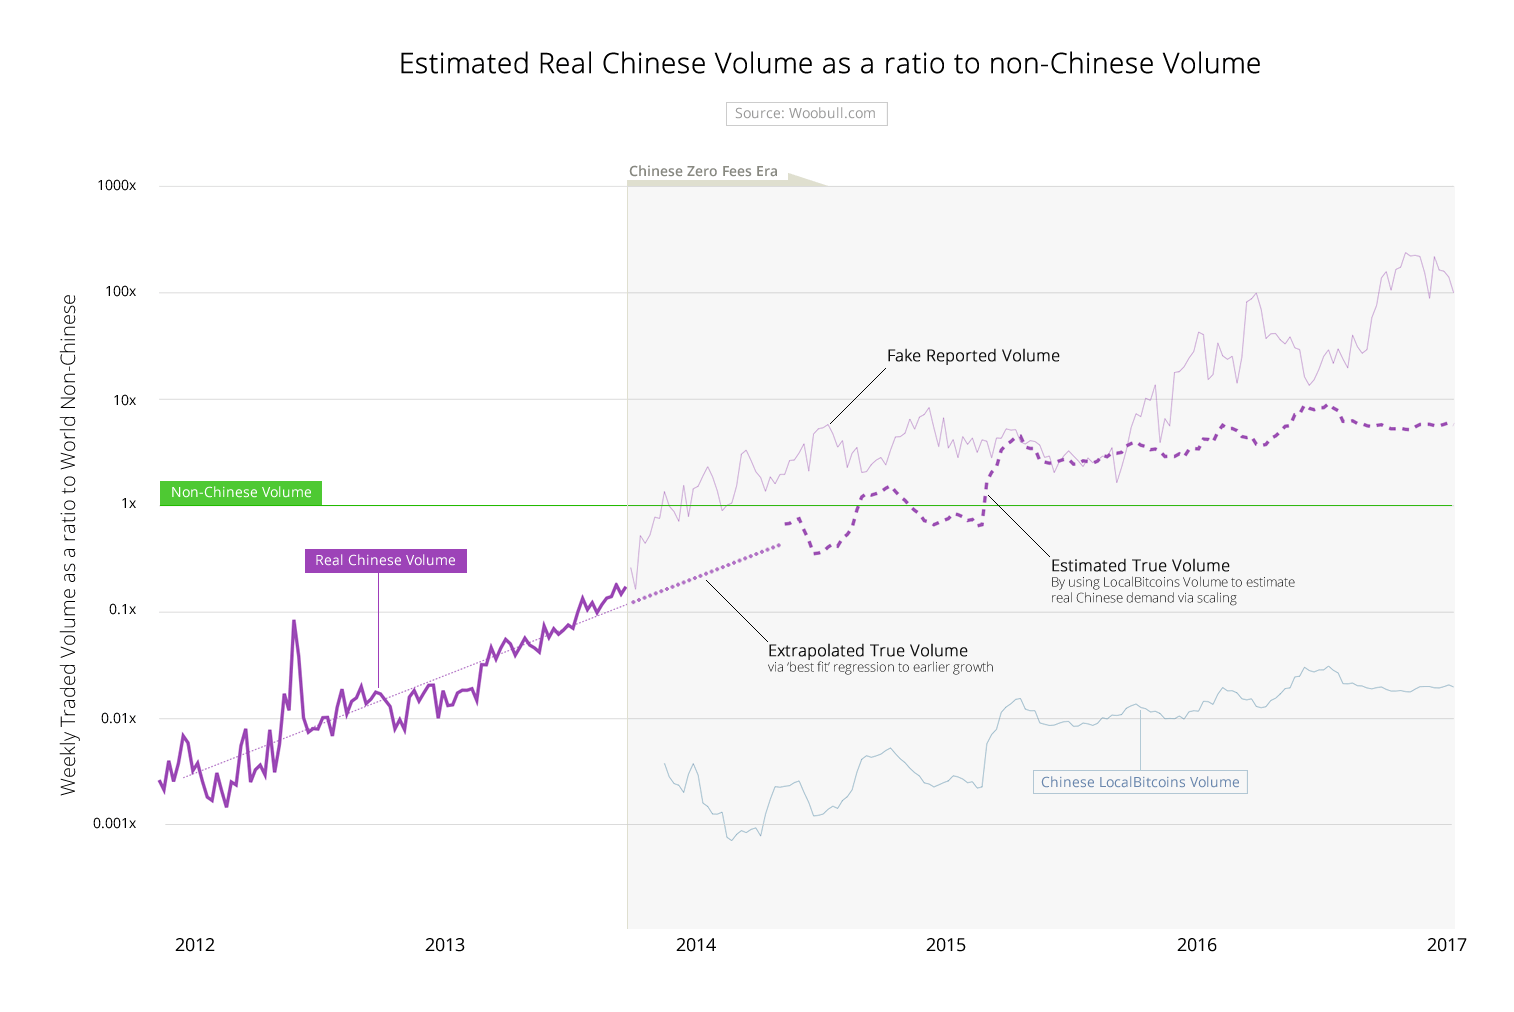
We are now ready to reconstruct real Chinese exchange volume. The historical estimates has 3 phases:
- Real Chinese volume before the zero fees era.
- Chinese volumes were in a predictable growth pattern prior to the zero fees era, so we can extrapolate the growth for long enough to get us to the next phase.
- Once LocalBitcoins entered the picture and was given enough time for it to gain adoption, we can scale up its volumes to estimate what the exchanges should have been doing as the two are tightly correlated.
The final composite looks like this:
The Results
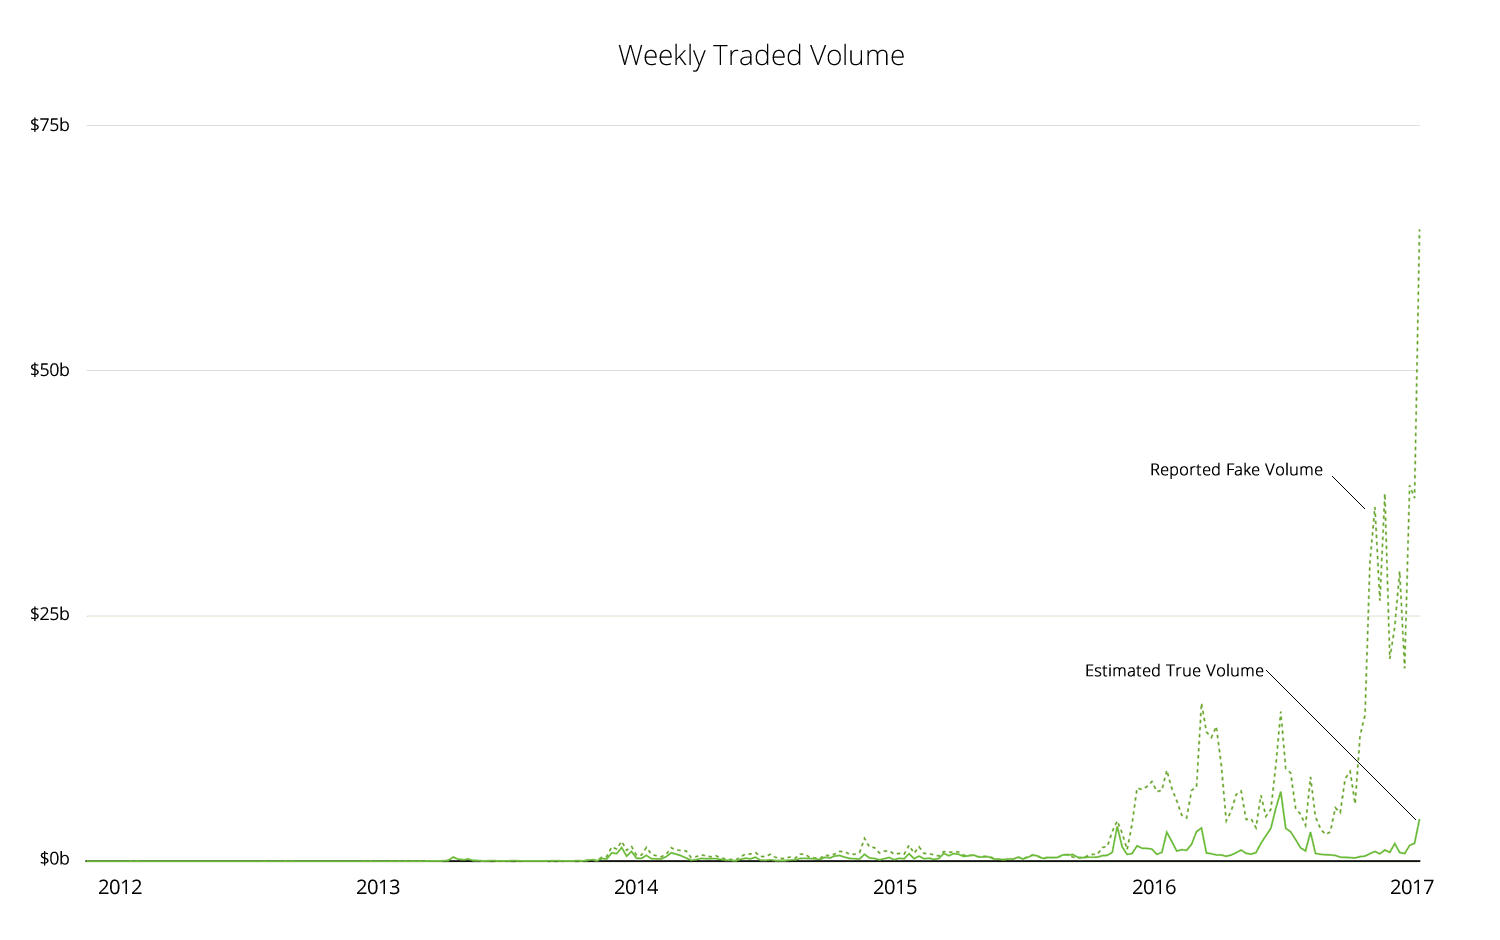
From this composite, we can reconstruct the true global market volume. Here’s the estimated true volume vs the reported volume. The differences are significant.
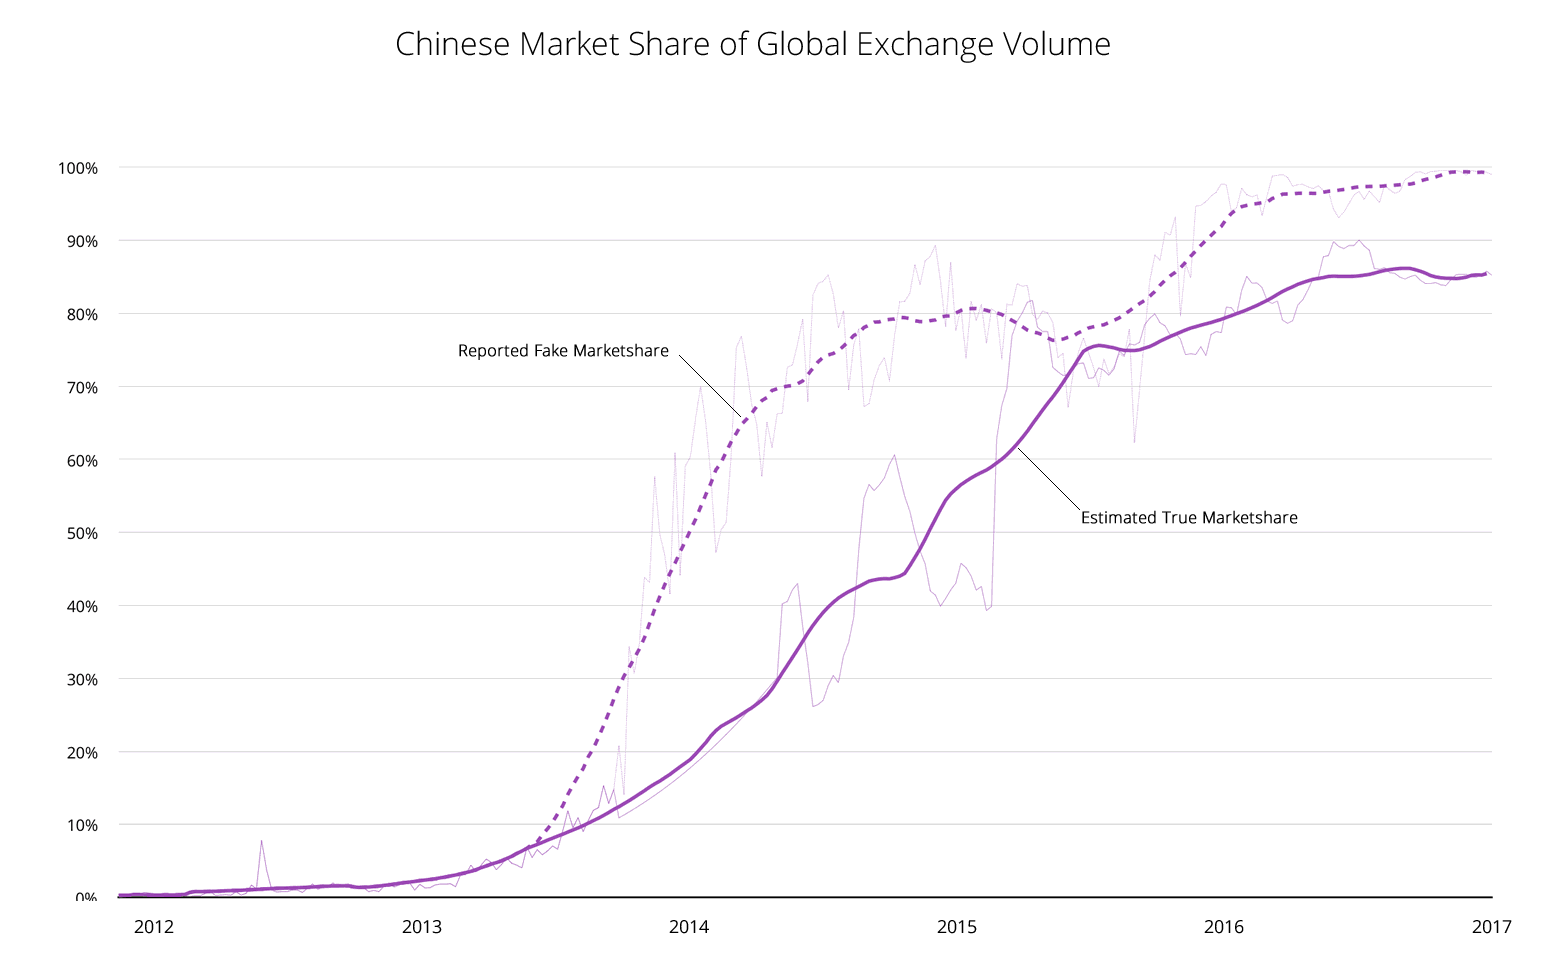
Expressed as Chinese marketshare of global exchange volume, it looks like this:

Expressed as a ratio of fake volumes to true volumes, it looks like this:
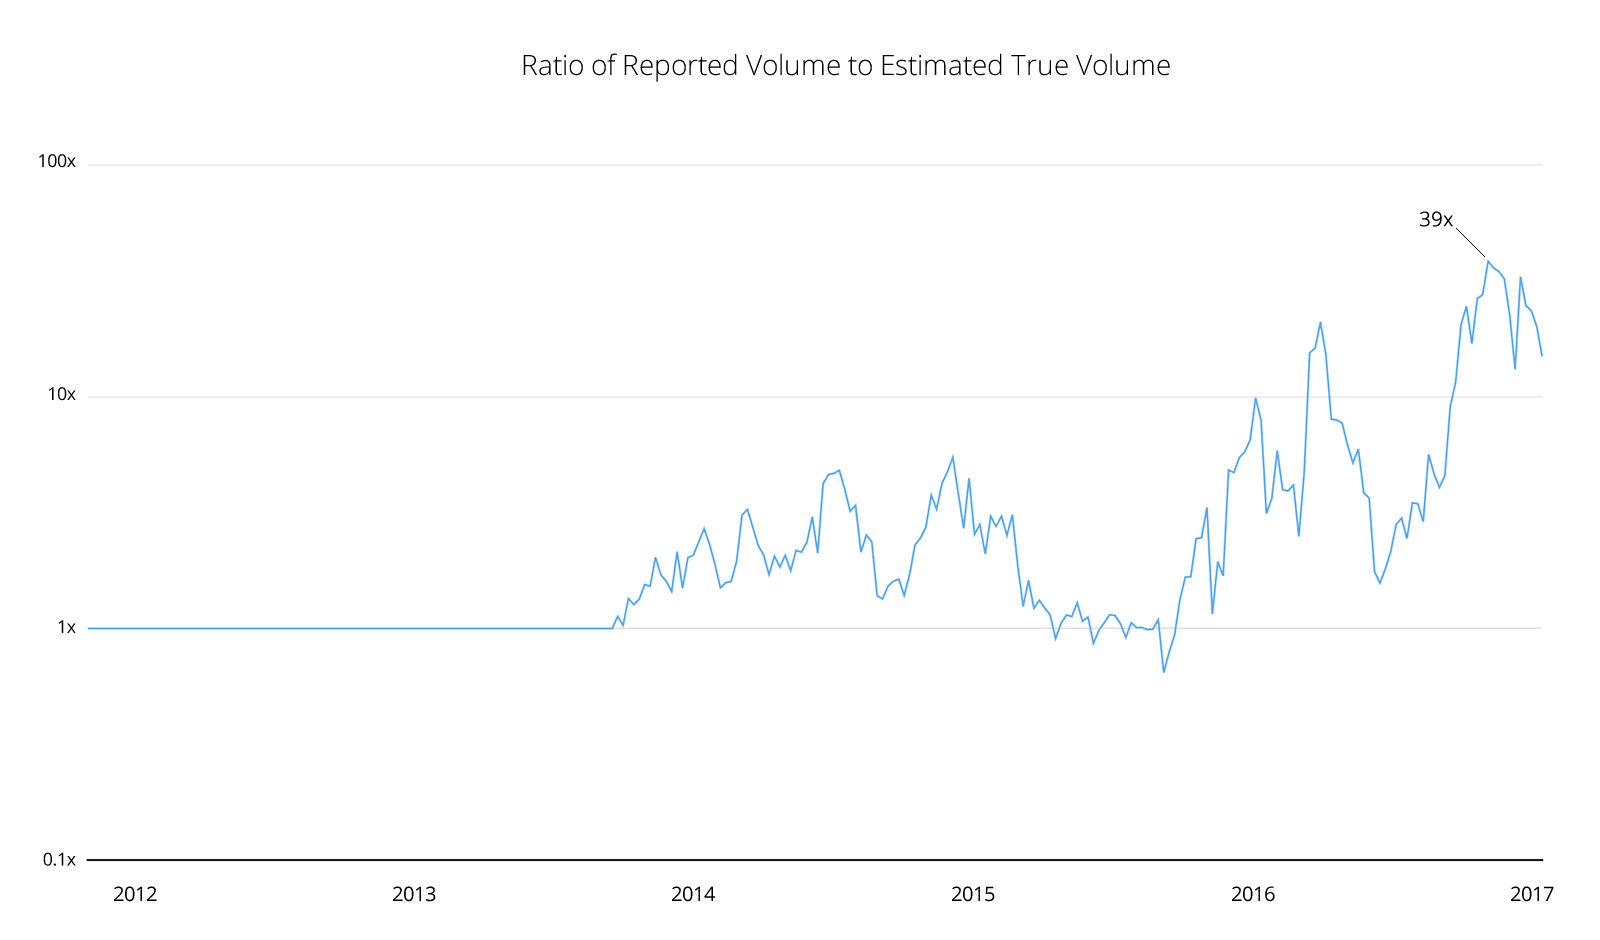
Yes, it’s been almost 40x over reported at times.
Conclusions
Previous educated guesses have put the real marketshare at 50%, but the data implies it’s much higher, around 85%. China remains the dominant player controlling Bitcoin volume, but not nearly as dominant as reported volumes suggest, about 10-40x less dominant, depending on the week.
I should mention that exchange volume is probably the minority of Bitcoin trade. As Vinny Lingham mentions, the exchanges set the prices, but most of the volume happens off exchanges in over the counter (OTC) trades, so the true globally traded volume is supposedly hidden.
Using similar methods to these here, I can probably make an estimate of OTC trade, but I’ll leave that to another day.
Footnotes
- The data source for Chinese and global exchange volumes was Bitcoinity.org
- The data source for LocalBitcoins volumes was Coin.dance
- I made no attempt to ascertain the error band for these estimates, but a glance at the methodology should give an idea how approximate the Chinese volume estimate would be. I’m guessing my estimate could be up to 2x out, but unlikely to be 10x out, by comparison reported volumes is up to 40x out. It’s likely the Peoples Bank of China will force fees to be charged in due time, if this is the case, we will actually get to see how accurate these results were.