Data visualisation: altcoins that achieved $5m market cap vs bitcoin
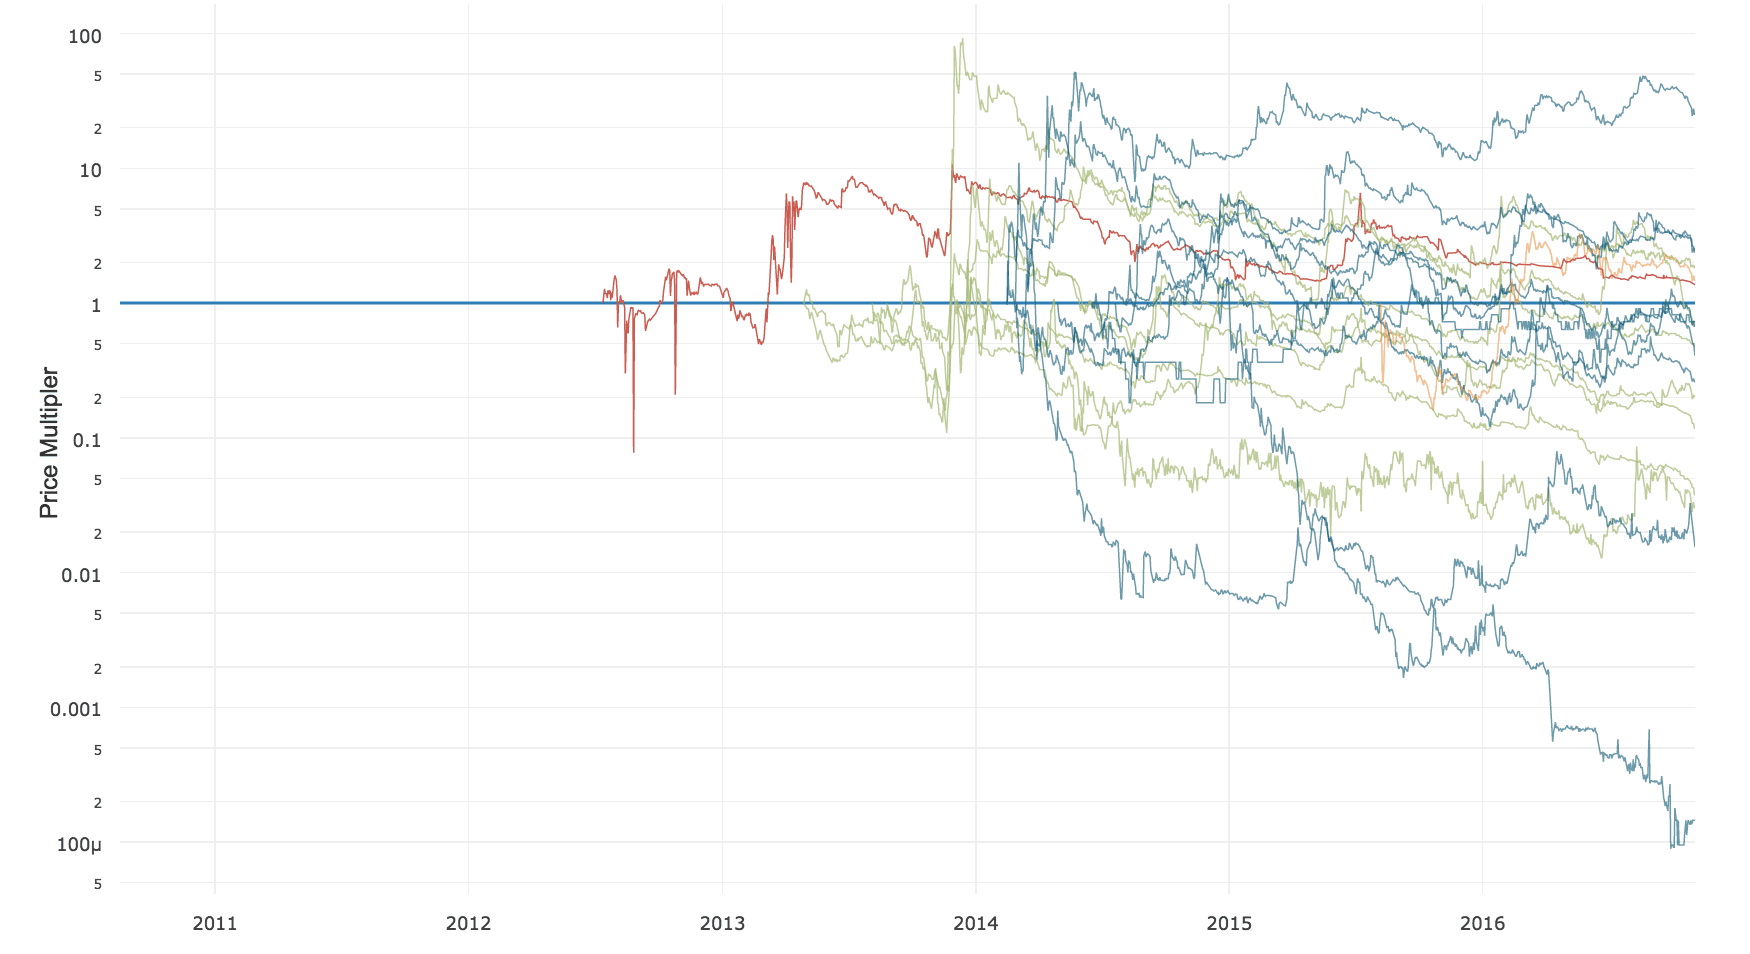
By popular demand from my last data visualisation for 118 coins, here’s the performance of bitcoin vs altcoins over time**.
Further details:
- The coins plotted are: XRP, LTC, OMNI, NXT, PPC, NMC, QRK, DOGE, XPY, BTS, AUR, DASH, MAID, XCP, XLM, BLK, ETH and BCN
- 6 outperformed bitcoin, from 1.4x to 25x, the best performer being DASH.
- 12 underperformed bitcoin, from 0.72x to an abysmal 0.000145x (essentially zero) which was XPY.
This graph does show some alts can hold their own against bitcoin if you pick them right. I’m dubious if any can hold this trajectory long term though. As there’s a rough pattern of upward initial momentum before gravity takes over.
Of interest is during the 2014-2015 year where bitcoin was flat, altcoins did not outperform bitcoin. During this phase there was a strong historical correlation between bitcoin and altcoin price performance. Previously during my index simulations, we found that altcoins suffered much worse than bitcoin during bear trends. Of late this correlation has been broken and we can see August of 2016 being the top an altcoin bubble and a divergence emerging as alts head downwards during a strong bull run for bitcoin.
** Plotted coins are any altcoin that has sustained a yearly average market cap beyond $5m in any calendar year of existence.